
LOUISVILLE, Ky. — A UPS cargo plane crashed and exploded in a massive fireball Tuesday while taking off from the company's global aviation hub in Louisville, Kentucky, killing at least four people and injuring 11 — numbers that were likely to grow, the state's governor said.
People are also reading…

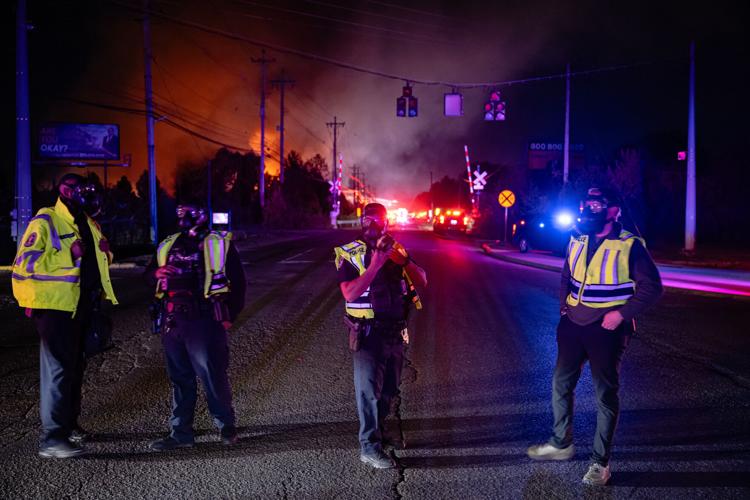
A fireball erupts near airport property after reports of a plane crash at Louisville International Airport, Tuesday, Nov. 4, 2025, in Louisville, Ky. (AP Photo/Jon Cherry)

Plumes of smoke rise from the area of a plane crash at Louisville Muhammad Ali International Airport on Tuesday, Nov. 4, 2025, in Louisville, Ky. (AP Photo/Jon Cherry)

Members of law enforcement wear respirators near the area of the reported plane crash at Louisville Muhammad Ali International Airport on Tuesday, Nov. 4, 2025, in Louisville, Ky. (AP Photo/Jon Cherry)
The 10 best airports in the United States
The 10 best airports in the United States

The holidays are approaching—and with them, some of the for airport travel. Indeed, over the past three years, Lyft riders have taken 10% more rides to and from airports in the month of November. And, in June 2024, air travel June 2023. If the trend continues, it will be another busy season for airlines ahead, reports.
As any seasoned traveler knows, airports are not created equal—and they can make the difference between a seamless journey and a harrowing one. So, to help prepare for any travel ahead, Lyft data and public data were used to score the in the U.S. on 12 measures across four dimensions: convenience, affordability, efficiency, and amenities. Those scores were then combined to find out which U.S. airport soars above the rest. (See methodology section for more details.)
Most Convenient: Austin-Bergstrom International Airport (AUS)
Each air journey begins and ends with a ride to and from the airport—and it's not always easy. Because airports require a lot of land, they tend to be located on the outskirts of cities, where they are less connected to public transportation and more vulnerable to traffic. Here are the easiest airports to get to:
Time by car: On average, passengers spend 26 minutes in a Lyft ride to or from an airport. However, travel to or from Las Vegas's Harry Reid International Airport (LAS), located just from the , takes just 16 minutes, on average.
Time by public transit: For those relying on public transit, the airport commute tends to be more of an ordeal, taking 41 minutes . But not so in Boston ––the airport (BOS) , the shortest of which takes about to reach downtown.
Average wait for pickup (minutes): On average, customers wait for a rideshare pickup for nine minutes across all airports. However, New York's LaGuardia Airport (LGA), where recent renovations were designed with , has reduced that time to six minutes.
Averaging across all three of these standardized measures, the airports of Austin (AUS), Salt Lake City (SLC), and Boston (BOS) all come out on top as the easiest to get to and from.
![]()
Most Affordable: Salt Lake City International Airport (SLC)

Flying is —and extra expenses at the airport can make it even more so. Here are the top airports based on affordability:
Parking cost: While the average to leave your car for a long weekend, parking is a steal at Houston's IAH ($27) but also in Texas generally: Parking at both DFW (Dallas Fort Worth) and AUS (Austin) costs under $40.
Cost of a Lyft ride to/from the airport: Rideshare offers a more dependable, convenient, and cheaper option than driving yourself (especially if you schedule your ride in advance). A Lyft ride to the airport costs $39 on average—and under $22 in LAS (Las Vegas).
Cost of Chex Mix: There's of about overpriced airport food, but someone finally decided to try to quantify it. An X user crowdsourced the price of an 8.75-ounce bag of at airports across the country. The results are not the most rigorous—some commenters found different prices in the same airport—but still provide a useful rough guide. While the in this subset of large airports is $8 (twice more than ), Chex Mix costs a whopping $14 at SEA (Seattle). Meanwhile, SLC (Salt Lake City) and MSP (Minneapolis) seemed to keep prices at more reasonable levels, under $4.
Taking all these measures into consideration (underweighting the Chex Mix), the cheapest airport is SLC in Salt Lake City, followed by CLT in Charlotte and AUS in Austin.
Most Efficient: Detroit Metropolitan Wayne County Airport (DTW)

, including cancellations, delays, missed baggage, and long TSA lines, have over recent years. While the is currently working to hold airlines more accountable, here are the airports that tend to offer the smoothest experiences:
Average TSA wait: There are few places where anxiety is as palpable as in a TSA line, where time-crunched travelers reckon with the possibility of missing their flight. The from 6 a.m. to 10 p.m. for the subset of large airports is 12 minutes, with a high in Austin (20 minutes) and a low in Detroit (seven minutes).
Share of flights on time: At least flights doesn't leave on time, usually because of . But some of the airports with the roughest weather see the fewest delays. MSP (St. Paul), located next to one of the in the U.S., and SLC (Salt Lake City), with its , both have the highest on-time rates of 84%.
Cancellations: That said, sunny PHX (Phoenix) has the lowest cancellation rate—it cancels roughly half as many flights as the average airport.
Averaging across all three measures, DTW (Detroit) comes out on top as the most efficient airport, followed by SLC (Salt Lake City) and PHX (Phoenix).
Best Amenities: San Francisco International Airport (SFO)

Extra time in the airport doesn't have to be a burden—with the right services. Here's a data-driven assessment:
Download speed: Many travelers spend their downtime online—taking work meetings, downloading films, etc. All that activity requires a strong internet connection. According to Ookla, the average download speed for top was 76 Mbps, but only ten of the top 30 airports in this data set––led by the tech hubs of SFO in San Francisco (162 Mbps) and SEA in Seattle (139 Mbps)––cleared the 100 Mbps for handling nearly any online activity.
Restaurants and shops per gate: For travelers experiencing delays or layovers, shopping and eating can provide some much-needed diversion. While most airports average about , the top airport for pre-gate entertainment is EWR (Newark), whose plentiful 1.75 establishments/gate include Guy Fieri's (home of the famous ).
Google rating: There are a number of other metrics that affect the airport experience—charging outlet availability, natural sunlight, cleanliness—that are a bit harder to measure. For a holistic proxy, this overview looked at Google ratings. While the average airport earns 4.1 out of five stars, TPA (Tampa) was a standout, with 4.6 stars and reviews citing its "" signage, "" bathrooms, and the .
Averaged across all of these measures, San Francisco (SFO) ranked highest for amenities, followed by Tampa (TPA) and Washington, D.C. (DCA).
Best Airport Overall: Salt Lake City International Airport (SLC)

Considering all four measures, the best airport is SLC in Salt Lake City, Utah. Accessible from the city center, featuring a new and spacious design as well as low rates of cancellation, and affordable Chex Mix? What's not to love?
Methodology

This sample considers the 30 largest airports in the U.S. as of 2023 across the following 12 metrics:
- Average commute by car (minutes) is calculated using Lyft data, as the median length of a Lyft ride that is going to/from an airport from Nov.1, 2023, to Nov. 1, 2024.
- Shortest commute by public transit (minutes) follows the report by and uses Google Maps to estimate the time it takes to get from the airport to the city center with public transportation.
- Average wait for pickup (minutes) is calculated using Lyft data, as the median time between when a Lyft ride is requested and a passenger is picked up from an airport from November 1, 2023, to November 1, 2024.
- Cost of parking is the average cost of parking at the airport for a long weekend in 2023, according to .
- Cost of a Lyft ride to/from the airport is calculated using Lyft data, as the median length of a Lyft ride that is going to/from an airport from November 1, 2023, to November 1, 2024.
- Cost of Chex Mix is calculated using this from 2024, with data for additional airports drawn from comments on and .
- Typical TSA wait (minutes) is estimated using , as the average wait between 6 a.m. and 10 p.m., with data collected on Tuesday, November 19, 2024.
- Percentage flights on time is calculated using data from the Bureau of Transportation Statistics, as the average across the share of an airport's and that were on time in 2023.
- Cancellation rate is calculated as the for airports in 2023, according to .
- Download speed is the in Q3 2022, with estimates provided by . For San Diego we used a proxy of 100 Mbps—the minimum speed that one can easily download and stream movies—as .
- Restaurant and shops per gate is calculated as the number of shops and restaurants for each airport (sourced from airport websites and the 2023 ), divided by the number of active gates at an airport.
- Google reviews is the average number of stars for the airport on Google Maps, collected Nov. 6, 2024.
was produced by and reviewed and distributed by Stacker.